How to Sync LinkedIn Ads to Looker Studio
How to Sync LinkedIn Ads to Looker Studio Using SyncRange
Most marketers I know want to visualize their LinkedIn Ads performance in a tool like Looker Studio, but don’t want to deal with manually exporting CSV files. CSVs are time-consuming and lead to stale dashboards that you’ll quickly forget about. SyncRange solves this by automatically connecting your LinkedIn Ads data to Looker Studio or exporting your data to Google Sheets or BigQuery, which Looker Studio can then use as live data sources. The result is up-to-date, interactive dashboards without any coding or manual work.
I’ll guide you through syncing your LinkedIn ads to Looker Studio with SyncRange.
Connecting LinkedIn ads to Looker Studio
- Connect Your LinkedIn Ads Account. In SyncRange, go to Connections → LinkedIn Ads and click Connect LinkedIn Ads Account. This will open a LinkedIn authorization screen. Grant the requested permissions and select the LinkedIn Ads account (Campaign Manager) you want to sync. After you authorize, SyncRange will confirm that the account is connected.
- Generate an API Key. In SyncRange, click on Account → Profile and scroll down to API Keys. Click New API Key and copy the key (it will only be shown once).
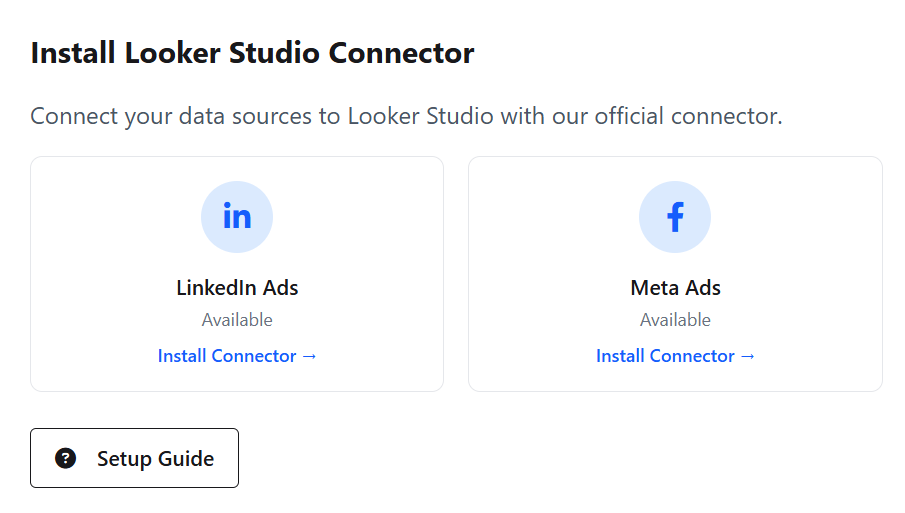
- Install the Looker Studio Connector. From your SyncRange dashboard, click Looker Studio in the navigation bar, then click Install Connector under LinkedIn Ads. This will open Looker Studio to add the connector.
- Authorize and Configure Your Data. When prompted, paste the API key you copied in step 2. On the next screen, select your LinkedIn Ads account, choose the data type you want to use (e.g., Campaigns), and select the desired timeframe.
Your LinkedIn Ads data is now connected directly to Looker Studio and ready for reporting.
Exporting LinkedIn Ads Data to Sheets or BigQuery
- Connect your LinkedIn Ads account. In SyncRange, go to Connections → LinkedIn Ads and click Connect LinkedIn Ads Account. This opens a LinkedIn authorization screen. Grant the requested permissions and select the LinkedIn Ads account (campaign manager) you want to sync. After you authorize, SyncRange will confirm that the account is connected.
- Link your Google account. Still in SyncRange, head to Connections → Google and authorize the Google account that has access to Google Sheets and/or BigQuery. This allows SyncRange to create spreadsheets or datasets for your LinkedIn data.
- Create a LinkedIn Ads export. In the SyncRange dashboard, go to Export Builder and click Create New Export. Choose LinkedIn as the data source, then select the connected LinkedIn Ads account. Next, pick where to send the data (select a Google Sheet or a BigQuery dataset that you set up earlier). Give your export a clear name, set the date range, and click through to configure the details.
- Configure the export fields. SyncRange lets you choose exactly what LinkedIn Ads data to pull. In the export settings, you’ll see tabs like Campaigns, Creatives, Audience, Conversions, etc. Enable the tabs you need and select the specific columns (metrics and dimensions) for each. You can also choose whether each export run should Append new data (for building historical trends) or Replace existing data (for a fresh snapshot).
- Each time you save the export and run it, SyncRange will pull the latest LinkedIn Ads metrics and write them into your Google destination on the schedule you set (daily, weekly, etc.). In other words, your LinkedIn Ads data will automatically flow into Google Sheets or BigQuery without any copy-pasting.
Now that your LinkedIn Ads data is landing in a Google destination, you can hook it up to Looker Studio. In Looker Studio, click Create → Data Source. Choose either the Google Sheets connector or the BigQuery connector based on where you sent the data:
- Google Sheets Connector: Select the spreadsheet and worksheet that SyncRange is populating. Looker Studio will import the rows and columns from that sheet as fields in your new data source.
- BigQuery Connector: Select your Google Cloud project, then pick the dataset and table that SyncRange created for each tab (each data tab becomes a separate table). This makes all the LinkedIn Ads metrics available in Looker Studio.
Once the data source is added, you can rename fields, change data types, or create calculated fields if needed (for example, a CTR metric = Clicks / Impressions).

Building LinkedIn Ads Reports
With your data source connected, use Looker Studio’s drag-and-drop editor to create charts and dashboards. Some useful reports might include:
- Campaign Performance: A time series chart of Impressions and Clicks over time, with filters for campaign or date range.
- Audience Breakdown: Bar or pie charts showing metrics such as Clicks and Spend by Industry, Company Size, or Job Function (if you included those fields).
- Key Metrics Scorecards: Simple scorecards showing totals like Total Spend, Total Clicks, Total Conversions, and calculated KPIs like CPC or CTR.
- Spend vs Conversions: A combo chart comparing ad spend and conversions per campaign to see efficiency.
These are just a few examples, and you can customize any chart based on the LinkedIn Ads fields you selected. The key advantage is that once the report is built, it will automatically refresh whenever SyncRange adds new data to your Google Sheets or BigQuery tables. Your LinkedIn Ads dashboards will always show fresh, up-to-date metrics.
Why Choose SyncRange
- Fully Automated: SyncRange eliminates the need for manual exports. Once setup, your LinkedIn Ads data flows into Google on autopilot.
- Fresh Data: Schedule Hourly, daily or weekly refreshes so your reports always use the latest campaign numbers.
- Easy Setup: No coding or API keys needed. Connecting accounts takes just a few clicks. You can start syncing in minutes.
- Flexible Destinations: Send data to Google Sheets (great for small accounts) or BigQuery (for large datasets), and use it instantly in Looker Studio.
- Cost-Effective: SyncRange offers a generous free plan, and Looker Studio is free to use. Automating your reporting this way saves time and money compared to custom solutions.
Ready to stop juggling spreadsheets and start growing your campaigns? Try SyncRange free today and get your LinkedIn Ads data flowing into Looker Studio in minutes.