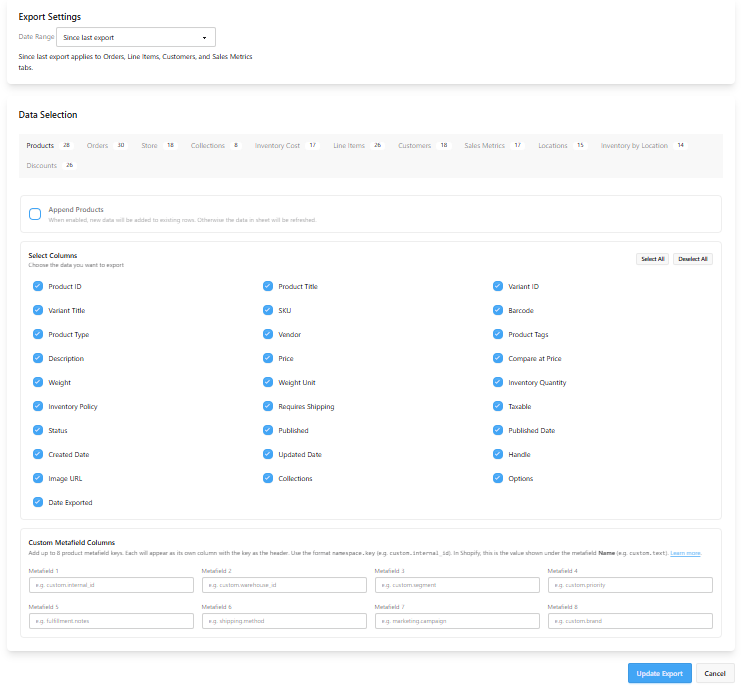
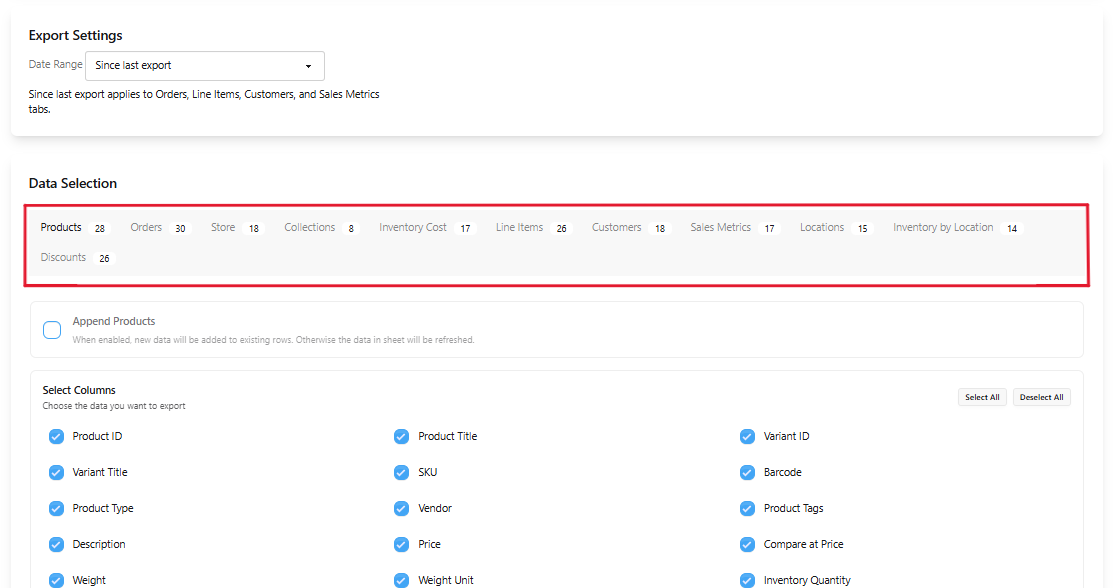
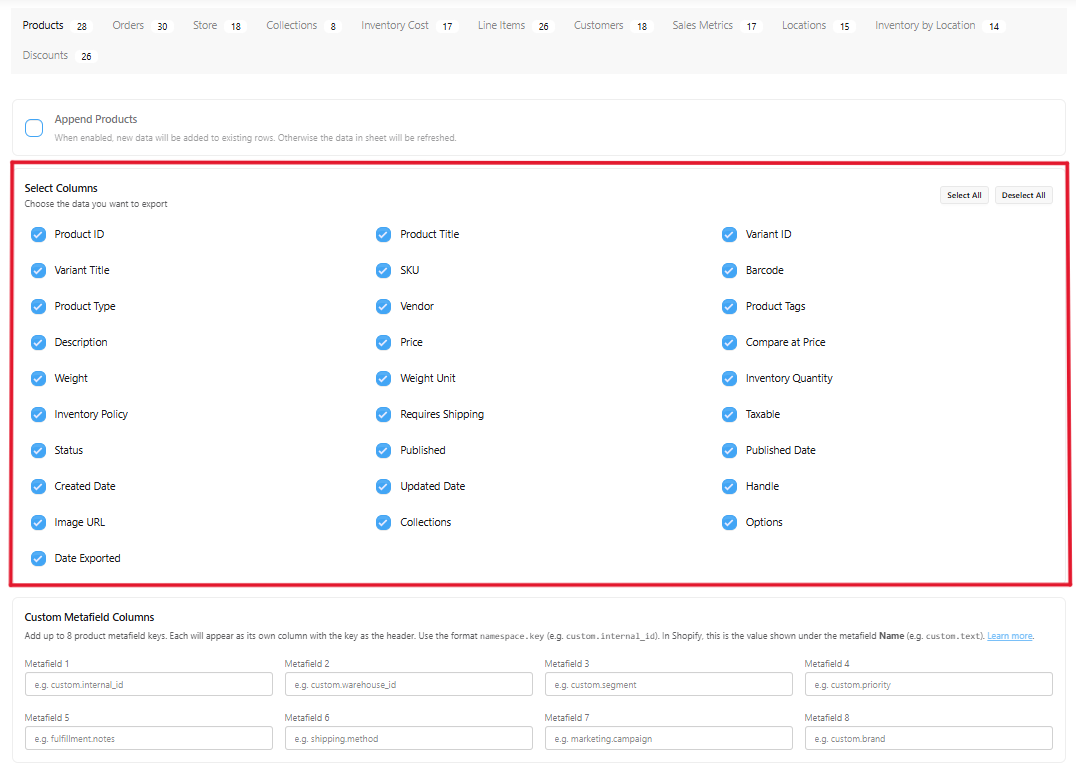
Configuring Shopify Exports

Learn how to set up and customize data exports from your Shopify store to Google Sheets with SyncRange.

Overview

After connecting your Shopify store, you can configure exports to send your e-commerce data to Google Sheets. This allows you to analyze sales trends, monitor inventory, track customer behavior, and create custom reports based on your store's data.

Prerequisites

Before configuring Shopify exports, make sure you have:

Creating a Shopify Export

Follow these steps to create a new Shopify export:

  1. Navigate to the Export Builder

    From your dashboard, go to "Export Builder" and click "Create New Export".

  2. Select Shopify as the Data Source

    Choose "Shopify" from the list of available data sources.

  3. Select Your Shopify Store

    If you have multiple Shopify stores connected, select the store you want to export data from.

  4. Choose a Google Sheet

    Select the Google Sheet where you want to export your Shopify data.

  5. Configure Export Settings

    Set up the export configuration as described in the sections below.

    Shopify Export Configuration

    The Shopify export configuration screen

  6. Save Your Export

    Click "Create Export" to save your configuration and create the export.

Export Configuration Options

When configuring a Shopify export, you have several options to customize what data is exported and how it's organized:

Basic Settings

Configure the fundamental settings for your export:

  • Date Range: Choose how much historical data to include. You can select from a variety of preset options:
    • Since last export: Incremental sync from the previous successful run timestamp to now (UTC)
    • Today: Export data from today only
    • Yesterday: Export data from yesterday only
    • Last 3 days: Export data from the past 3 days
    • Last 7 days: Export data from the past week
    • Last 14 days: Export data from the past 2 weeks
    • Last 28 days: Export data from the past 4 weeks
    • Last 30 days: Export data from the past month (default)
    • Last 90 days: Export data from the past quarter
    • Last 6 months: Export data from the past 6 months
    • Last year: Export data from the past year (365 days)
    • This month: Export data from the start of the current month to today
    • Last month: Export data from the entire previous month
    • This quarter: Export data from the start of the current quarter to today
    • Maximum: Export up to 2 years of historical data (730 days). If you have a large amount of data, use manual runs only (not scheduled) and one data tab at a time, large windows are resource-intensive.
    • Backup (10 years): (Paid Pro, Scale, and Growth plans; not trial) Export up to about 10 years of history. Uses manual Run only, your schedule is paused while this date range is selected.

    The date range applies to Orders, Line Items, Customers, Sales Metrics, Product Analysis, Refund Analysis, Refund Line Analysis, Payouts, and Balance Transactions only. Products, Store, Locations, Inventory, and Inventory Locations always export all current data (no date filter). Choose a range that matches your reporting needs, shorter ranges are faster to export, while longer ranges provide more historical context.

    For Since last export, the first run falls back to today up to now (UTC), then future runs only fetch new rows for supported tabs (Orders, Line Items, Customers, Sales Metrics, Product Analysis, Refund Analysis, Refund Line Analysis, Payouts, Balance Transactions).

    Line Items, Product Analysis, Refund Analysis, and Refund Line Analysis refunds in incremental runs: Refund rows are matched against the refund processed date, not the original order's creation date. That means a refund processed in the current incremental window is included even if the underlying order was created months earlier (and won't be missed when comparing totals to your Shopify dashboard).

    Customers in date ranges: The Customers tab is filtered by customer creation date. A customer is included only when their account was created within the selected window — customers who placed an order in the window but signed up earlier will not appear.

    Tip: 'Since last export' is especially well suited to Orders in Append mode, so each run adds only new rows to your Google Sheets and BigQuery tables.

Data Tabs

Shopify exports are organized by data types, with each type creating a separate tab in your Google Sheet. The interface uses a tab-based layout where you can configure each data type independently:

Shopify Data Tabs

The tab interface for configuring different data types

Available data tabs include:

  • Products: Information about your product catalog
  • Orders: Details about customer orders, including discount codes applied
  • Store: General information about your Shopify store
  • Inventory: Current inventory levels for your products
  • Line Items: Individual product lines, shipping charges, and refund lines within orders (with per-line discounts and currency where applicable)
  • Customers: Information about your customers
  • Sales Metrics: Aggregated sales performance data
  • Product Analysis: Per-product rollups over the date range (gross sales, discounts, returns, net sales, tax, units, orders), built from the same line-item and refund data as Line Items
  • Refund Analysis: Per-product refund-focused rollups over the date range (refunded units, refund amount, refund rates vs sales, average refund value, days to refund), using the same line-item and refund pipeline as Line Items and Product Analysis
  • Refund Line Analysis: One row per refund line item with return reason, restock type, and customer note from Shopify Returns
  • Locations: Information about your store locations
  • Inventory Locations: Inventory data broken down by location
  • Discounts: Information about your store discounts and usage
  • Payouts: Shopify Payments bank transfer summaries with rolled-up charge, refund, and adjustment fees
  • Balance Transactions: Per-transaction Shopify Payments ledger entries with processing fees, order links, and payout links
  • Customer Segments: Customer-to-segment membership rows for segmentation analysis.

For each data tab, you can:

  • Enable/Disable: Choose whether to include this data type in your export by selecting columns
  • Set Data Handling: Choose whether to append new data or replace existing data
  • Select Columns: Choose which specific data fields to include for this data type

Column Selection

For each data tab, you can select which columns (fields) to include in your export:

Shopify Column Selection

The column selection interface for a data tab

Each data tab has its own set of available columns. Example columns include:

Data Tab Example Columns
Products Product ID, Title, Variant ID, SKU, Barcode, Vendor, Product Type, Tags, Description, Status, Published, Handle, Image URL, Price, Compare at Price, Weight, Inventory Quantity, Options, Collections, Created/Updated Date
Orders Order ID, Order Number, Order Date, Order Date Time, Customer ID/Name/Email, Fulfillment Status, Financial Status, Currency, Subtotal, Total Price, Refunded Amount, Shipping, Tax, Total Discounts, Quantity Sold, Discount Codes Applied, Discount Code IDs, Manual Discount Codes, Automatic Discount Titles, Discount Codes Applied (JSON), Discount Code IDs (JSON), Note, Note Attributes, Source, Date Exported
Line Items Line Item ID, Order ID, Order Number, Order Date, Order Date Time, Line Item Name, Line Item Type (Product, Shipping, Refund), Quantity, Unit Price, Currency, Total Price, Refunded Amount, Discount Amount, Discount Codes Applied, Discount Code IDs, Manual Discount Codes, Automatic Discount Titles, Discount Codes Applied (JSON), Discount Code IDs (JSON), Discounted Price, Tax fields, SKU, Variant/Product fields, Fulfillment fields, Date Exported
Product Analysis Product ID, Product Title, Product Type, Vendor, Currency, Gross Sales, Discounts, Returns, Net Sales, Tax, Total Sales, Units Sold, Orders, Date Exported — one row per product and currency for the selected period; sorted by product ID
Refund Analysis Product ID, Product Title, Product Type, Vendor, Currency, Units Sold, Gross Sales, Orders With Product, Refunded Units, Refund Amount, Refund Line Items, Orders Refunded, Net Units, Net Sales, Refund Rate (Units), Refund Rate ($), Avg Refund Value, Avg Refund Quantity, Avg Days to Refund, Date Exported — one row per product and currency; sorted by refund amount (highest first)
Refund Line Analysis Refund Line ID, Order ID, Order Name, Order Date, Order Date Time, Refund Date, Line Item Name, Refunded Quantity, Refund Price (per unit), Refund Amount, SKU, Variant ID/Title, Product ID/Title/Type, Vendor, Return Reason, Return Reason Note, Customer Note, Restock Type, Restocked, Discount fields, Is Gift Card, Date Exported — one row per refund line item
Discounts Discount ID, Discount Type, Title, Summary, Status, Discount Code, Total Used Count, Code Used Count, Limit Total Times, Limit One Use Per Customer, Starts At, Ends At, Created At, Updated At, Value Type, Value, Value Currency, Minimum Purchase Type, Minimum Value, Eligibility Type, Eligibility Values, Eligibility Customer Segment IDs, Eligibility Customer Segment Names, Eligibility Customer Segment IDs (JSON), Eligibility Customer Segment Names (JSON), Discount URL
Payouts Payout ID, Payout Date, Status, Type, Net Amount, Currency, Charges Gross, Charges Fee, Refunds Gross, Refunds Fee, Adjustments Gross, Adjustments Fee, Date Exported — one row per bank transfer; filtered by payout date
Balance Transactions Balance Transaction ID, Transaction Date, Type, Source Type, Test, Order ID, Order Number, Payout ID, Payout Status, Gross Amount, Fee Amount, Net Amount, Currency, Source ID, Source Order Transaction ID, Adjustment Reason, Description, Date Exported — one row per ledger entry; filtered by processed date
Customers Customer ID, First Name, Last Name, Email, Notes, Created At, Last Order Date, City, Country, Country Code, Customer Segment IDs, Customer Segment Names, Customer Segment IDs (JSON), Customer Segment Names (JSON)
Inventory Inventory Item ID, Variant ID, Product ID, Product Title, SKU, Quantity, Unit Cost, Inventory Value, Tracked, Country of Origin, HS Code

You can use the "Select All" and "Deselect All" buttons to quickly manage your column selections.

Some tabs pair comma-separated values with JSON columns for easier parsing in BigQuery and scripts. See Customer Segment and list JSON columns under Advanced features.

Looking for a full per-column reference with descriptions of each available field? See the Shopify data reference.

Product Analysis: A per-product summary of revenue, discounts, returns, units and orders over the selected date range — one row per product (or per variant when that option is enabled). Rows are sorted by Product ID, then variant ID when that mode is on, then currency. Append is off by default so each run replaces the sheet.

Refund Analysis: A per-product refund summary over the selected date range — refunded units, refund amount, refund rates, average refund value, and average days from order to refund — with units sold and gross sales shown alongside for context. Only products with at least one refund in the window appear; products with sales but no refunds are excluded. Sorted by Refund Amount (highest first). Append is off by default.

Refund Line Analysis: One row per refund line item over the selected date range, with order, product, and variant context, plus return reason metadata when the refund came from a Shopify Return (return reason, return reason note, customer note) and the refund line's restock type / restocked flag.

Payouts: One row per Shopify Payments bank transfer over the selected date range, with rolled-up charge, refund, and adjustment fees. Filtered by Payout Date (issued_at). Requires Shopify Payments — see Shopify Payments exports.

Balance Transactions: One row per Shopify Payments ledger entry (charge, refund, adjustment) with per-transaction Fee Amount, plus links to the order and payout. Filtered by Transaction Date (processed_at). Join to Orders on Order ID for per-order fee analysis.

For details on how refunds, totals, and date columns work across these tabs, see How refunds and totals work and Order Date vs Order Date Time under Advanced features.

Reconciling Orders and Line Items exports

Orders and Line Items use slightly different filters when you select the same date range, because they answer slightly different questions. The table below summarises which orders/refunds show up where:

Scenario In Orders? Products + Shipping in Line Items? Refund row in Line Items?
Order created in window, never refunded Yes Yes n/a
Order created in window, refunded in window Yes Yes Yes
Order created in window, refunded before the window Yes (Total Price already reflects the refund; Refunded Amount is populated) Yes No (refund happened in an earlier window)
Order created before the window, refunded in window No No Yes (Order Date on the refund row is the original order date — outside the window)
Order created in window, refunded in a future window Yes Yes No (refund hasn't been processed yet at the time of this export)
  • Filter used by Orders: the order's created_at. Total Price, Subtotal and Refunded Amount reflect the order's current state (all-time refunds included).
  • Filter used by Line Items products + shipping: the order's created_at (same as Orders).
  • Filter used by Line Items refund rows: the refund's processed date (refund.createdAt), so refunds processed in the window are still picked up even if the order was created earlier.
  • Product Analysis, Refund Analysis, and Refund Line Analysis: aggregate or filter the same product and refund line rows as Line Items for the window (order date for product lines; refund processed date for refunds when using Since last export).

Practical implication: if you sum Total Price across Orders and across Line Items for the same window they may not match exactly, because the two exports include slightly different sets of orders for refund-related rows. Use the Refunded Amount column on either tab to see how much of an order has been refunded as of now.

Refunded but no refund line item? When an order in the Orders tab has a non-zero Refunded Amount but no matching Refund rows in Line Items, the refund happened in an earlier window than the one you're exporting. Re-export with a wider date range that includes the refund's processed date to surface those rows.

Data Handling

For each data tab, you can choose how to handle the exported data:

  • Replace (default): Each export run will clear existing data and replace it with new data
  • Append: Each export run will add new data rows without removing existing data

The append option is particularly useful for building historical datasets over time. When enabled, each export adds new rows to the destination and leaves existing rows. When disabled, the destination is fully refreshed and existing data is removed.

Pro Tip

Use the append option for data you want to track over time (like orders or sales metrics), and use replace for data that represents current state (like inventory or product details).

Best Practices

  • Start Simple: Begin with just one or two data tabs and a few essential columns
  • Focus on Key Data: Select only the columns you actually need for your analysis
  • Consider Sheet Size: Be mindful that exporting too many columns or rows can make your Google Sheet slow or hit size limits
  • Use Appropriate Date Ranges: Choose a date range preset that matches your reporting needs. For daily reports, use "Today" or "Yesterday". For weekly analysis, use "Last 7 days" or "Last 14 days". For monthly reports, use "Last 30 days" or "This month". For comprehensive historical analysis, use "Last 90 days", "This quarter", or "Maximum"
  • Append Strategically: Use append for historical data tracking, but be aware that it will increase your sheet size over time
  • Create Multiple Exports: Instead of one large export with everything, create separate focused exports for different purposes
  • Check Your Exports: After creating an export, run it manually and verify the data before setting up automation

Export efficiency tips

These choices reduce how much work each run does, which helps on very large stores and lowers the chance of slow runs or Shopify gateway errors.

  • Customers tab — segment columns: If your Customers export is taking a long time, remove the customer segment fields (Customer Segment IDs, Customer Segment Names, and the two JSON variants). That usually speeds things up on large stores. Turn them back on when you need segment data on each customer row.
  • Date range: On tabs that honor it (Orders, Line Items, Customers, Sales Metrics, Product Analysis, Refund Analysis, Refund Line Analysis, Payouts, Balance Transactions), a narrower range means less data per run.
  • Fewer tabs and columns: Each tab and column adds work and destination size. Focused exports are easier to schedule and debug than one export that pulls everything.
  • Split heavy needs: Multiple smaller exports (or schedules staggered by time) often behave better than a single run that refreshes many large tabs at once.

Per-column context for the Customers tab is also noted under Shopify data reference → Customers.

Advanced features

Optional columns and structured formats for power users, BigQuery, and automation.

How refunds and totals work (Orders, Line Items, Product Analysis, Refund Analysis)

Line Items totals: The Total Price column is the net price after discounts for both product and shipping rows (it equals Discounted Price). Refund rows use a negative Total Price equal to the refund amount. Sum Total Price across product, shipping, and refund rows of the same order to reconcile to your Shopify dashboard's net sales (excluding tax). Use Discount Amount to see how much discount was allocated to each line.

Refund rows in Line Items: Each refunded line item is emitted as its own row with Line Item Type = Refund, a negative Total Price, and the original product's SKU, Variant ID/Title, Product ID/Title, Product Type and Vendor populated, so per-product revenue queries deduct refunds from the right product.

Refunded Amount on Line Items: The Refunded Amount column is per-row: refund rows show the amount refunded for that specific line, and product/shipping rows show 0. Sum Refunded Amount across all rows of an order to get the total refunded for the order (or use the Orders tab's Refunded Amount column for a single number per order).

Orders totals: The Subtotal and Total Price columns reflect the current order values (refunded line items, shipping refunds and tax refunds are subtracted), so they match Shopify's "Total sales" view. Refunded Amount remains a separate column showing how much was refunded. For a fully refunded order both Subtotal and Total Price will be 0, with Refunded Amount equal to the original total.

Product Analysis and Refund Analysis totals: Gross Sales is product price × quantity from sales in the window, before discounts and before refunds. Net Sales then subtracts Discounts and Returns, matching Shopify's Sales by product report.

Order Date vs Order Date Time (Orders, Line Items)

On both Orders and Line Items, the Order Date column is a date only (YYYY-MM-DD), which is friendlier for grouping and pivoting. A separate Order Date Time column is available if you need the full timestamp (YYYY-MM-DD HH:MM:SS). Existing BigQuery tables with an order_date column keep their existing schema; if that column was previously typed as TIMESTAMP in BigQuery, new values are written as midnight (00:00:00) — add the Order Date Time column to recover full precision.

Segment and list JSON columns (Customers, Discounts, Orders, Line Items)

Segment and discount lists are available as plain comma-separated columns and as JSON array strings on the same row. Use the JSON variants for reliable parsing in BigQuery (PARSE_JSON) or in Google Apps Script (JSON.parse).

  • Customers: Customer Segment IDs and Customer Segment Names, plus Customer Segment IDs (JSON) and Customer Segment Names (JSON).
  • Discounts: Eligibility Customer Segment IDs and Eligibility Customer Segment Names, plus Eligibility Customer Segment IDs (JSON) and Eligibility Customer Segment Names (JSON).
  • Orders and Line Items: use Manual Discount Codes for manually entered discount codes and Automatic Discount Titles for automatic discount titles only. You can also export Discount Codes Applied / Discount Code IDs with Discount Codes Applied (JSON) and Discount Code IDs (JSON). Per-line behavior and ID resolution are described under Discount codes JSON (Orders and Line Items) below.

If the Customers export feels slow, try removing the segment columns—see Export efficiency tips.

Discount codes JSON (Orders and Line Items)

On Orders and Line Items, optional JSON string columns complement the comma-separated discount fields: one column lists labels (codes or automatic discount titles), the other lists resolved catalog discount IDs where available.

  • Discount Codes Applied (JSON): A JSON array of the same values as Discount Codes Applied (comma-separated). Use JSON.parse in Sheets scripts or PARSE_JSON in BigQuery on the cell value.
  • Discount Code IDs (JSON): A JSON array of numeric Shopify discount catalog IDs for code-based discounts.
  • Manual Discount Codes: Customer-typed discount codes and admin-applied manual discount titles (e.g., one-off discounts added when editing an order).
  • Automatic Discount Titles: Automatic discount titles only.
  • Automatic ID matching note: We do a best-effort ID lookup for automatic discounts by exact title. If an old title is reused later (for example after deleting an older discount), historical rows can map to the newer discount with the same title.
  • Line Items: Labels and IDs reflect discounts allocated to that row (product or shipping). Empty discounts export as [] for both JSON columns.

Shopify Payments exports (Payouts, Balance Transactions)

SyncRange can export Shopify Payments financial data when your store uses Shopify Payments and has granted the read_shopify_payments_accounts and read_shopify_payments_payouts scopes. This covers platform processing fees and bank payout reconciliation.

  • Payouts tab: Bank transfer summaries — one row per payout with net amount and rolled-up charge, refund, and adjustment fees. Filtered by payout issued_at. Supports Since last export.
  • Balance Transactions tab: Transaction-level ledger — one row per charge, refund, or adjustment with Gross Amount, Fee Amount (the per-transaction processing fee), Net Amount, and links to Order ID and Payout ID. Filtered by processed_at. Supports Since last export.

Reconnect required: Stores connected before this feature was added must reconnect Shopify to grant the new scope. If the scope is missing or Shopify Payments is not activated, Payouts and Balance Transactions tabs are skipped (the rest of the export continues).

Full column definitions: Payouts and Balance Transactions.

Order note attributes (additional details)

When you enable Note Attributes in the Orders tab, SyncRange exports Shopify order additional details as a single JSON array string column. This works in both Google Sheets and BigQuery exports.

  • Column name: Order Note Attributes
  • Format: JSON array of key/value objects, for example [{"key":"delivery_window","value":"Afternoon"},{"key":"order_priority","value":"Urgent"}]
  • Duplicate keys are preserved (array format avoids data loss).
  • Useful for reliable filtering and parsing in BigQuery across orders and joins.

Order metafield columns

When you configure the Orders tab, you can add up to eight custom metafield columns. Each metafield you specify becomes its own column in your export: the column header is the metafield name (e.g. custom.internal_id), and each row shows that metafield’s value for that order. This works for both Google Sheets and BigQuery exports.

  • In the Orders tab, find the Custom Metafield Columns section.
  • Enter the metafield key in namespace.key format (e.g. custom.internal_id, custom.warehouse_id, delivery.instructions).
  • You can use Metafield 1–8 for up to eight different order metafields.
  • Leave a field blank if you don’t need that slot.

To get the exact metafield name from Shopify, use your Shopify admin (see the image below for where to find it). The name is always in the form namespace.key (for example, custom.po_number). Copy that value and paste it into the corresponding Metafield 1–8 field in SyncRange.

The image below shows where to find or copy the order metafield name (namespace.key) in your Shopify dashboard—e.g. Settings → Custom data → Orders, or an order detail page where the metafield is shown.

Where to find the order metafield name in the Shopify admin (Settings → Custom data → Orders or order detail metafields)

Finding the metafield name in Shopify

In Shopify admin: go to Settings → Custom data → Orders (or the metafield definition you use). The metafield name is shown as Namespace and Key—combine them as namespace.key (e.g. custom.internal_id). You can also see it when editing an order and viewing its metafields. Use that exact value in SyncRange’s Metafield 1–8 fields.

Product metafield columns

When you configure the Products tab, you can add up to 8 custom product metafield columns. Each metafield you specify becomes its own column in your export: the column header is the metafield name (e.g. custom.internal_id), and each row shows that metafield’s value for that product (or variant). This works for both Google Sheets and BigQuery exports.

  • In the Products tab, find the Custom Metafield Columns section.
  • Enter the metafield key in namespace.key format (e.g. custom.brand, custom.segment).
  • You can use Metafield 1–8 for up to eight different product metafields.
  • The same namespace.key format and Shopify admin locations apply as for order metafields; for products use Settings → Custom data → Products to find metafield names.

Collection metafield columns

When you configure the Collections tab, you can add up to 8 custom collection metafield columns. Each metafield you specify becomes its own column in your export: the column header is the metafield name (e.g. custom.internal_id), and each row shows that metafield’s value for that collection. This works for both Google Sheets and BigQuery exports.

  • In the Collections tab, find the Custom Metafield Columns section.
  • Enter the metafield key in namespace.key format (e.g. custom.segment, custom.brand).
  • You can use Metafield 1–8 for up to eight different collection metafields.
  • In Shopify admin use Settings → Custom data → Collections to find collection metafield names (Namespace and Key combined as namespace.key).

Troubleshooting

Missing Data

If your export is missing expected data:

  • Verify that you've selected the appropriate columns for the data tab
  • Check if the date range is appropriate for the data you're looking for
  • Ensure that the data exists in your Shopify store
  • Check if you have the necessary permissions to access that data

Export Errors

If your export fails with errors:

  • Check the export logs for specific error messages (see Viewing Export Logs)
  • Verify that your Shopify connection is still active
  • Check if your Google Sheet is accessible and has not been deleted
  • Try reducing the number of columns or the date range if you're hitting API limits

Performance Issues

If your exports are running slowly or timing out:

  • Reduce the number of columns you're exporting
  • Choose a shorter date range (e.g., "Last 7 days" instead of "Maximum")
  • Split large exports into multiple smaller exports
  • For stores with large catalogs or high order volumes, focus on the most recent or most important data

Stop Juggling Dashboards. Start Growing Get your data flowing today, free plan available.