When configuring an Analytics export, you'll have several options to customize what data is exported:
Basic Settings
Configure the fundamental settings for your export:
- Export Name: A descriptive name to identify your export
- Date Range: How much historical data each export run includes. Presets include:
- Today — current calendar day
- Yesterday — previous calendar day only
- Last 3, 7, 14, 28, 30, or 90 days — rolling windows ending today
- Last 6 months — about the past 180 days
- Last year — about the past 365 days
- This month — first of the current month through today
- Last month — full previous calendar month
- This quarter — first day of the current calendar quarter through today
- Maximum (2 years) — up to about two years ending today; very large windows are slower and still subject to your property’s GA4 data retention in Google Analytics
- Custom range: pick exact From and To dates (maximum 1 year; end date cannot be in the future). Exports that same calendar period on every run. Scheduled runs are paused while this is selected. Use Run now. GA4 data retention in Google Analytics still applies to how far back the property can return.
On each run, rolling and calendar presets are recalculated from the current date. Exports created with the older 7-, 30-, or 90-day options behave as before. The old “Last day” menu option is removed; any export that still has that value stored is treated like Yesterday (previous calendar day only).
Dimension Tabs
Analytics exports are organized by dimensions, with each dimension creating a separate tab in your Google Sheet. The interface uses a tab-based layout where you can configure each dimension independently:
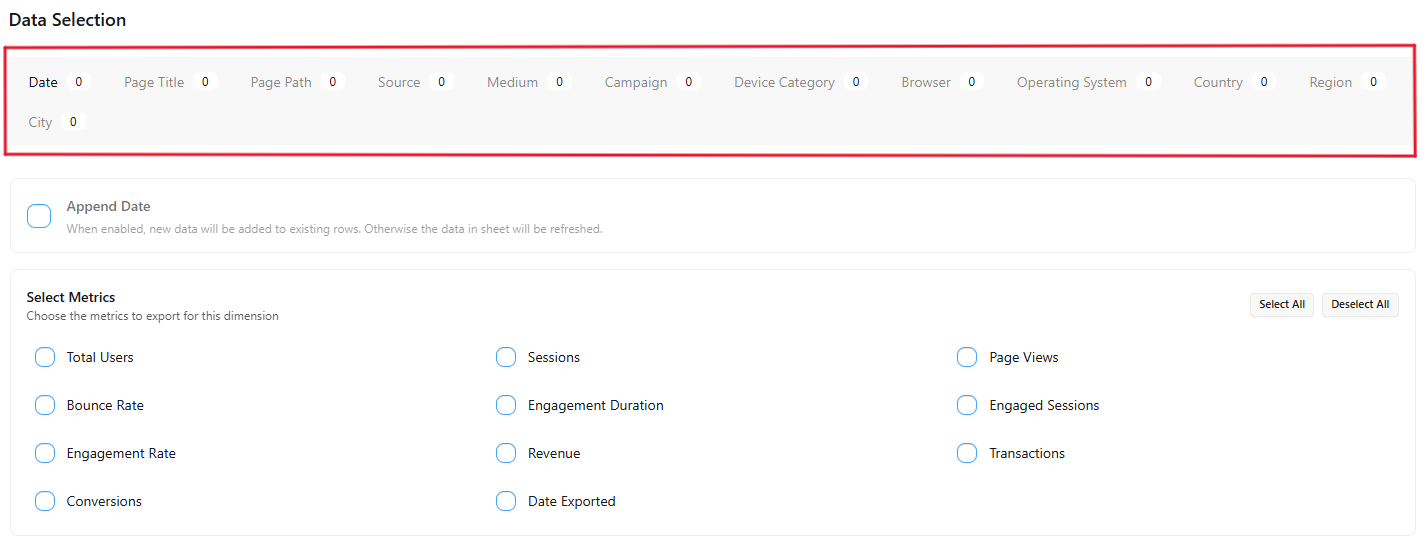
The tab interface for configuring different dimensions
Common dimensions include:
- Property Summary: Property-wide totals for the export date range, with period start and end columns
- Date: Performance data broken down by day
- Source, Medium, Campaign: Traffic and campaign breakdowns
- Page path / Page title: Content performance
- Country, Region, City: Geographic locations of your users
- Device Category, Browser, Operating System: Technology breakdowns
- Event name: Analytics event types (e.g., purchase, signup)
For each dimension tab, you can:
- Enable/Disable: Choose whether to include this dimension in your export by selecting metrics
- Set Data Handling: Choose whether to append new data or replace existing data
- Select Metrics: Choose which performance metrics to include for this dimension
Property Summary does not use a GA4 breakdown dimension. It returns one row per export with property-wide totals for the configured date range. Period Start and Period End columns identify the window for each run (useful with append mode).
For other dimensions, GA4 exports range totals by default (one row per breakdown value). Enable time breakdown to split results into daily, ISO weekly, or monthly rows. Page path, page title, and event name with time breakdown enabled can produce very large exports; use shorter date ranges when needed.
User metrics
GA4 user counts depend on how data is broken down. Match the tab and grain to the analysis you need:
- Property Summary: Active Users and Total Users are deduplicated across the export’s full date range.
- Date: User metrics are calculated per day. They are not additive across rows—a user who visits on multiple days appears in each day’s count.
- Other dimensions (range totals): User metrics are deduplicated per breakdown value over the export window (for example, per country or source). Totals across rows may double-count users who appear in more than one segment.
Active Users counts users with at least one engaged session and generally matches the “Users” metric in the GA4 reporting interface. Total Users counts everyone who triggered any event in the period. Period totals always reflect the date range set on the export.
Metrics Selection
For each dimension, you can select which metrics to include in your export:
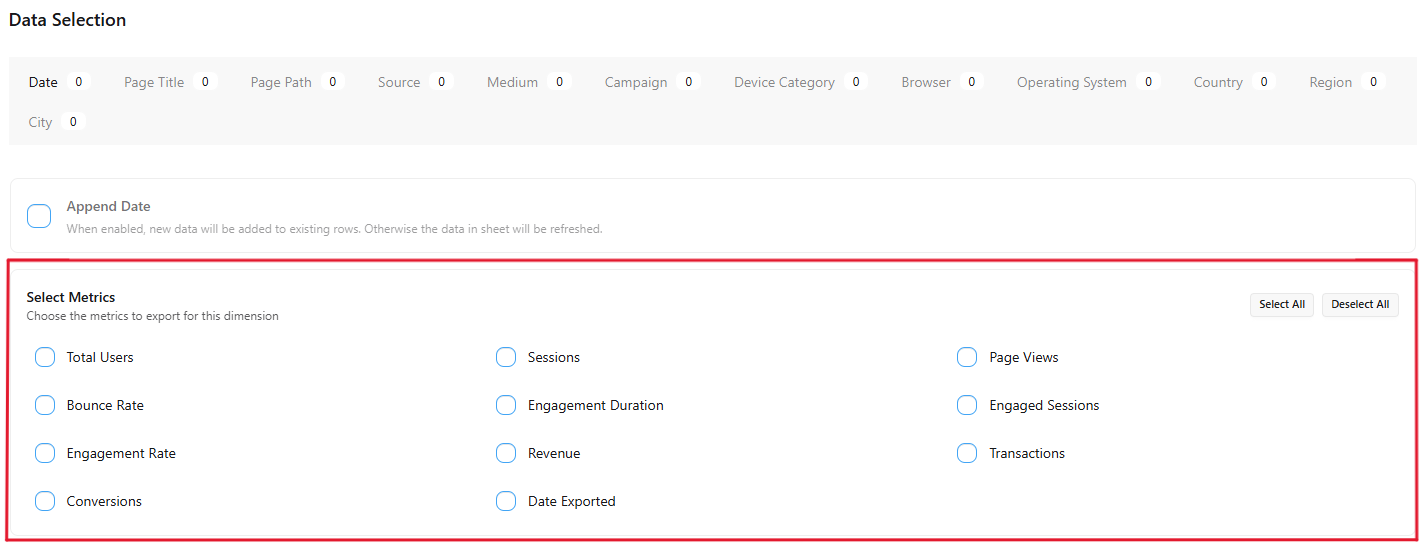
The metrics selection interface for a dimension
Available metrics include (availability may vary slightly by dimension; incompatible combinations are skipped during export):
- Total Users: Unique users who triggered any event in the period
- Active Users: Unique users with at least one engaged session; aligns with GA4 UI “Users” in most reports
- Sessions: Total number of sessions
- Page Views: Total screen and page views
- Event count: Number of events (not available with Source, Medium, or Campaign tabs)
- Bounce Rate: Percentage of non-engaged sessions
- Engagement Rate: Percentage of engaged sessions
- Engagement Duration: Total user engagement time in seconds (Property Summary, Date, and Event name tabs only)
- Engaged Sessions: Sessions that lasted longer than 10 seconds, had a conversion, or had at least two page views
- Revenue: Total revenue from ecommerce and other monetization events
- Transactions: Number of purchase events
- Conversions: Number of conversion events
- Date Exported: Timestamp when SyncRange ran the export
You can use the "Select All" and "Deselect All" buttons to quickly manage your metric selections.
Data Handling
For each dimension tab, you can choose how to handle the exported data:
- Replace (default): Each export run will clear existing data and replace it with new data
- Append: Each export run will add new data rows without removing existing data
The append option is particularly useful for building historical datasets. When enabled, each export adds new rows to the destination and leaves existing rows. When disabled, the destination is fully refreshed and existing data is removed.

 Install on Shopify